
Dwella (f.k.a Zillow+)
ROLE
Group member
TEAM
Class group project; 3 members (including myself)
TOOLS
Figma, Otter.ai, Goodnotes, Adobe Illustrator, Whiteboard
TIMELINE
2 months (October-December 2025)
SKILLS
Customer Discovery · Product Scoping · API Integration · Data Modeling · Experiment Design · Metrics Definition · Product Roadmapping
As part of a class group project, my team and I designed a mobile application for potential homebuyers to optimize for commute times given current lifestyle demands (school, work, gym, coffee, etc).
Table of Contents
1. Problem
2. Customer Discovery
3. Wireframing + Demo
4. Testing
5. Metrics
6. Next Steps
7. Final Thoughts
My Role and Ownership
This was a three-person class project, and my role focused on product definition and decision-making under constraints. I personally owned:
-
User interviews and synthesis using JTBD and Five Whys
-
Problem framing around commute blind spots and lifestyle visualization
-
Definition of the core value proposition and MVP scope
-
Metric selection, including the North Star Metric and supporting KPIs
-
Early feasibility exploration around API usage and data structure
My teammates focused primarily on visual design execution, crafting the lo-fi wireframes, and developing the backend for our prototype, given their engineering backgrounds. I acted as the product lead, ensuring insights translated into buildable product decisions.
1. Problem
Nearly everyone has used Zillow at least once in their life. As a student, probably to check the value of our own homes (or our dream homes). As an adult, to scout potential houses. But things change when you look at Zillow as a potential homebuyer. And one of the things that you think about a lot more as a homebuyer is commute.
The daily commute weighs heavily on homebuyers' decisions. 62% of employed buyers said that their commute to work or school was very or extremely important in their decision of which home to buy. A similar share of renters (57%) said the same when deciding where to sign a lease (Zillow)
Say for instance, we have a potential homebuyer, Sarah. See her user persona below:

Sarah is trying to find the right home in Durham that fits her daily routine (leave home, workout, coffee, work at Duke Hospital). For every home Sarah is interested on Zillow, she has to plug in those 4 addresses onto Google Maps, and do it at exactly the right time to account for traffic.
Given that someone can look to up to 250 homes online, Sarah would have to repeat that process 250 times. So Sarah's problems in a nutshell:
Sarah's Problems
1.
Commute blind spots
-
Users must manually toggle between platforms, creating friction
-
Existing real estate platforms) are static for commute times
2.
Visibility into surroundings
-
Map provide little insight into the “lived experience” of a neighborhood
3.
Personal priorities
-
How do I know if its the right match for me?
-
Lack of personalization → post-move dissatisfaction
IN A NUTSHELL:
I can’t visualize my potential lifestyle on Zillow.
2. Customer Discovery
We know Sarah's story is real because we've talked with homebuyers from across the country, different age demographics, different jobs, and different types of homes. For each speaker, we applied two different frameworks in our conversations.
Who we spoke to

Frameworks applied
“5 Whys” Root-Cause Probing
Applied the Five Whys framework to move beyond surface-level user frustrations and identify underlying behavioral drivers. This technique aligns with first-principles reasoning; we used it in our interviews to strip basic statements down (ie “I like xxx”) until we identified the root cause.
Examples from interviews:
When Respondent #4 (renter) said, “I like maps because they help me see what’s nearby — but they’re not easy to use,” our follow-up questions drilled deeper:
-
Why does she rely on maps? → To visualize access to essentials.
-
Why is that important? → Because proximity reduces daily stress.
-
Why does that matter? → Convenience defines satisfaction for urban renters.
This iterative “peel back the onion” process reframed her complaint from a UI issue to a contextual visibility problem, informing the “Limited visibility into surroundings” insight.
Jobs to be done (JTBD) framework
The Jobs to Be Done (JTBD) framework is that centers on the underlying job a customer is trying to accomplish instead of other features like demographics. We used these in our interviews to identify the underlying goal of why they wanted to use, for example, a specific filter.
Examples from interviews:
Respondent #8 (buyer) explained, “I’d love to know the full picture upfront — things like realtor fees or who’s paying commission”
-
We reframed this from a data request to a deeper job — “help me make confident, informed financial decisions.”
-
Similarly, Respondent #2 (realtor) noted, “Location is a huge factor — proximity to the city raises property values”, positioning commute insights as part of her clients’ core “job” of maximizing value, not simply filtering listings.
This JTBD lens guided synthesis toward user intent and desired outcomes, rather than feature-level pain points.
Key Takeaways
92%
of interviewees said they had to manually use Google Maps next to Zillow to make decisions
“Zillow didn’t let me input my work address and a departure time. It would be very helpful if it did. I manually checked Google Maps at 8:30 a.m. on several days to see real commute times.”
Respondent #5 (buyer, LA)
Proximity to the city raises property values. For example, a house in Brockton might sell for more than a similar one in Middleborough simply because it’s closer to Boston and has better access to the commuter rail. Location is a huge factor.”
Respondent #2 (realtor, MA area)
“Zillow doesn’t have that filter, so we manually drew circles on maps around train stations and checked each address in Google Maps to see if it was actually walkable and safe.”
Respondent #6 (buyer, NY)
“When we moved to Lynn, I knew traffic was bad, but it turned out worse than I thought. There are fewer highway access points compared to Lawrence, so my commute time increased more than I’d hoped.”
Respondent #8 (buyer, Boston)
Customer Journey
Based on our conversations, we mapped out the typical homebuying process:


Our Value Prop
So based on our research, our (Dwella's) value prop is a platform to simplify Sarah's search.
3. Wireframing + Demo
Lo-Fi Wireframe
LOCATION SEARCH SYSTEM

Lo-Fi > Hi-Fi

Demo
Technical Feasibility Considerations
While designing the commute layer, I worked with teammates to pressure-test technical feasibility early rather than treating engineering as a downstream step. We discussed how commute calculations would rely on Google Maps Distance Matrix and Places APIs, including tradeoffs around rate limits, cost, and latency.
To keep the MVP realistic, I scoped the first version to support a limited number of destinations per user and a single departure time, rather than real-time routing updates. This allowed us to test whether commute context meaningfully influenced decisions before investing in more complex infrastructure.
These metrics explain why our North Star Metric is moving:
4. Testing
To validate whether the concept worked beyond wireframes, we tested the prototype with 12 homebuyers and renters across different cities and housing stages. Participants were asked to complete a realistic task: identify one or two homes they would seriously consider purchasing or renting, using Dwella instead of their existing workflow (Zillow + Google Maps).
What happened in practice:
-
10/12 users successfully identified a viable home without opening Google Maps
-
8/12 users said commute visualization changed which listing they preferred
Users spent less time toggling between tools and more time comparing tradeoffs within a single flow
The strongest signal wasn’t speed, but confidence: users reported feeling more certain that a home “fit their life,” not just their budget.
One unexpected insight emerged during testing: several users preferred homes with slightly longer commutes if the route passed familiar or desirable landmarks (coffee shops, parks). While we did not build this into the MVP, it informed a roadmap idea around “commute quality” vs commute time, influencing how we framed future lifestyle scoring.
However, if given more complete resources, we would have expanded our sample size to 50 users. An outline of how we would go about this process can be seen below:

5. Metrics
🌟 North Star Metric
% of visits with map interactions
=
visits with ≥1 commute interaction total visits
total visits
Why this metric:
-
This is an engagemnet metric; ngagement with the commute layer is how we know our value prop.
-
Actionable, leading indicator that follows SMART framework
-
Can be compared to meaningful baseline
-
Historical data (same as competitor data): Zillow + Trulia
-
Hypothesis: If we improve this metric, then it could improve retention + repeat usage
-
Ties back to our A/B testing
-
-
We would track over time + segments (user regions, age cohorts)
-
-
Validates whether Dwella actually solves our main problem (Friction Point #1)
Supporting Metrics
-
# of visits
-
Has Zillow as a baseline comparison, as Zillow reports this in their filings
-
-
Average Visit Length (Time On App): average # of seconds a user spends per session
-
Has Zillow as a baseline comparison, as Zillow reports this in their filings
-
-
# of unique users: first time an individual accesses Dwella
-
Has Zillow as a baseline comparison, as Zillow reports this in their filings
-
-
% of users that save a home: measures downstream intent → future business value
LT Impact (Unit economics metrics)
LTV (Lifetime Value): dollars per user across their life cycle (driven by return visits, listing engagement, etc.) or
LTV = (avg revenue per user per month) x (avg months retained)
-
High LTV is good because it justifies investment in commute intelligence
-
Shows that personalized search creates financially meaningful behavior
CAC (Customer Acquisition Cost): how expensive it is to attract each new user
CAC = (total marketing spend) / # of new users acquired
-
Dwella is inherently self-differentiating given its value add (the commute intelligence)
-
So: low CAC is good because it could imply user satisfaction → retention → word of mouth + organic growth
-
Also means North Star Metric doesn’t require expensive growth loops
-
6. Next Steps
Roadmap

1. Core Feature Stabilization (near-term)
We need to access Google’s Places API and Commute Matrix API, in order to calculate distances between locations.
We think that these APIs are a key investment.

2. Context expansion (mid-term)
Goal: Layer in environmental and neighborhood context
-
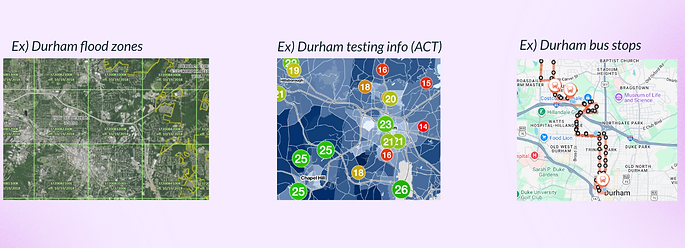
Add environmental transparency layers: flood zones, safety insights, noise levels, school district quality
-
Roll out regional commute presets (NYC → train/subway, LA → car)
-
Add multi-commuter profiles for roommates + couples
3. Lifestyle Intelligence (long-term)
Goal: Integrate New ML Technology
-
Introduce ML model that learns from:
-
user preferences (listings viewed, listings favorited)
-
adjusts Lifestyle scores (Beli-style)
-
-
LLMs can power conversational search
-
Ex: “Find me a place within 20 minutes of work and near two coffee shops”
-

7. Final Thoughts
